A candlestick chart is a type of chart that is used to track the price action of a security over time. It is a popular tool among traders and investors, as it can provide a good amount of information in a small amount of space. In this article, we’ll answer the question, “What is a candlestick chart?” Keep reading to learn more about candlestick charts and how they can be used to make better investment decisions.
What are candlestick charts?
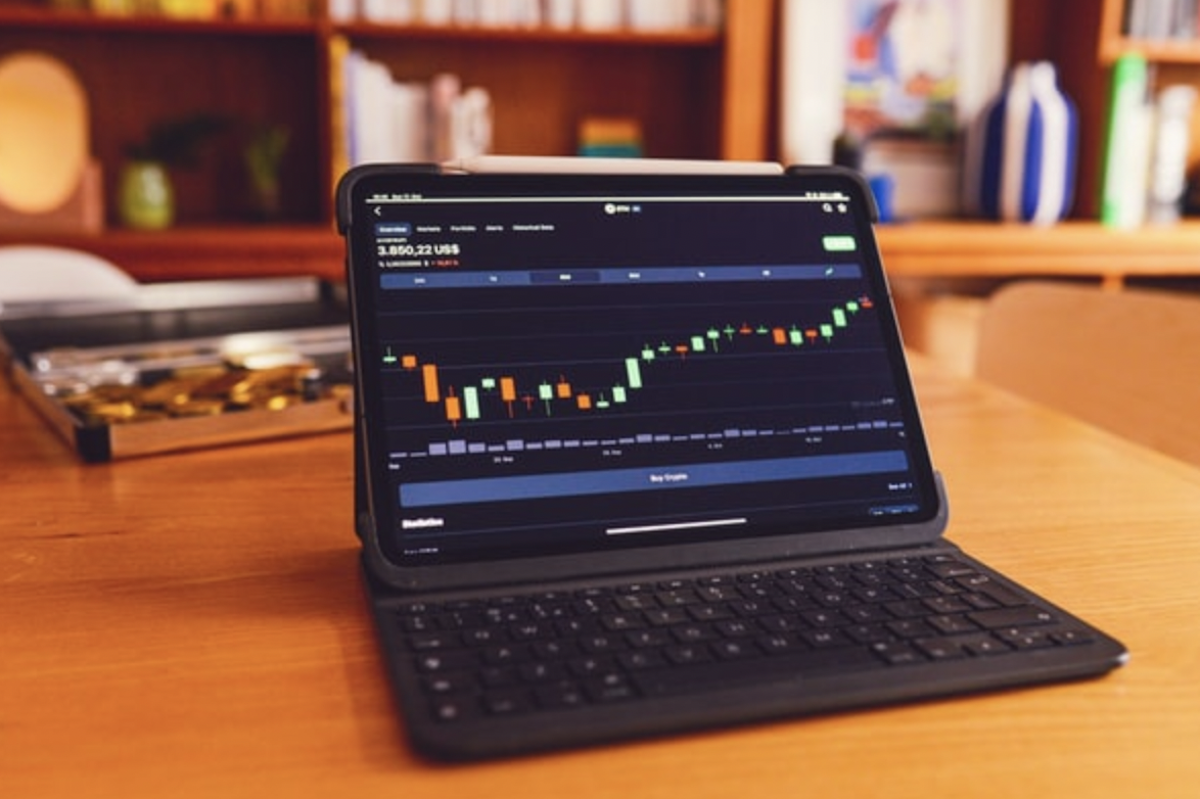
A candlestick chart is a graphical representation of price movements over time. It is used to visualize the opening and closing as well as the high and low prices of a security or financial instrument. The body of the candlestick is the price range between the open and close, and the thin lines above and below the body represent the high and low prices.
A candlestick chart usually consists of four different parts called the body, the wick, the Doji, and the Shadows. The body is the most important part of the candlestick, as it reflects the price range between the open and close. The wick is the part of the candle that extends above and below the body, and it represents the high and low prices of the security or financial instrument. The Doji is a special type of candlestick that has a very small body, and the Shadows are the lines that extend above and below the Doji.
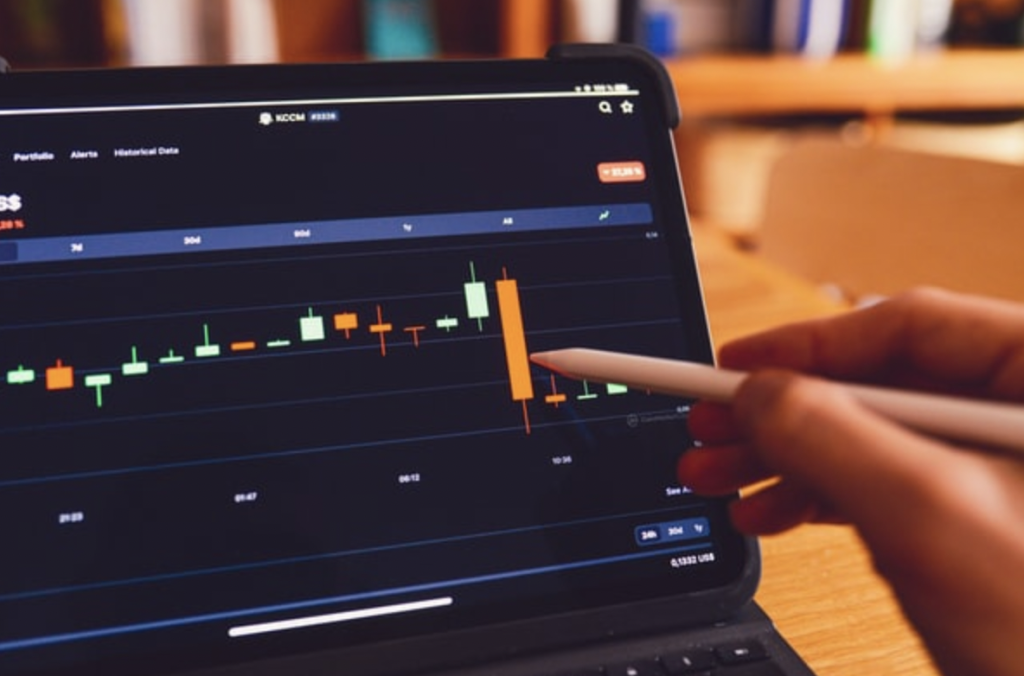
Candlesticks can be colored or patterned to make them easier to read. The colors are usually either black or white, and the patterns can be bullish, marked in green, or bearish, marked in red. When a candlestick is bullish, it means that the close was higher than the open, and when it is bearish, it means that the close was lower than the open. There are also different types of candlesticks, such as the Hammer, Shooting Star, and engulfing candlesticks.
Candlestick charts can be used to identify trends.
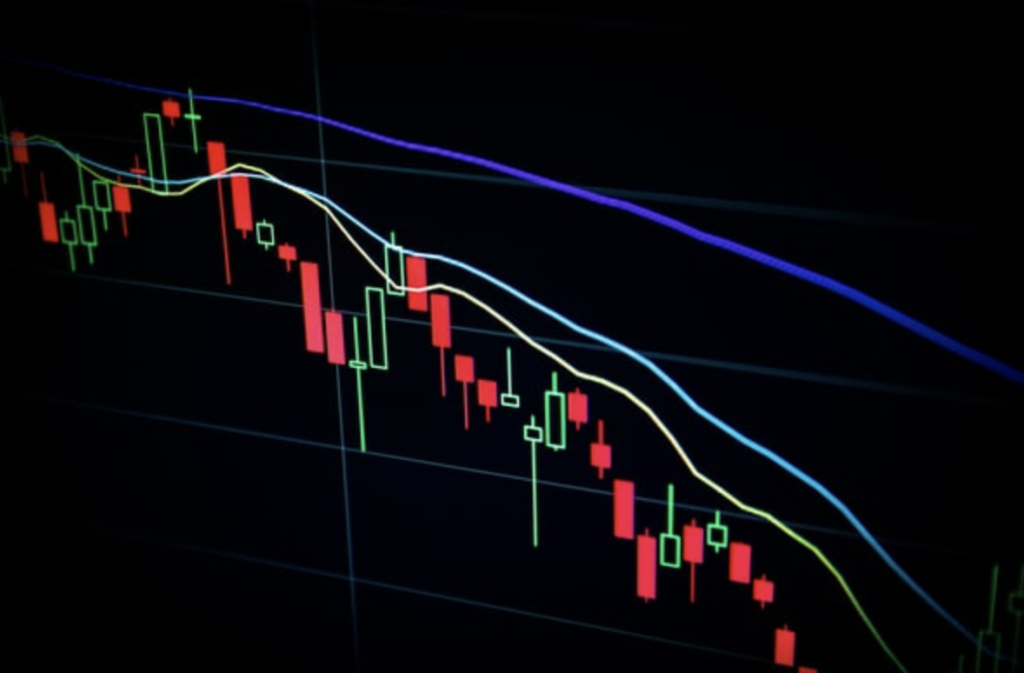
When it comes to trends, look for bullish and bearish trends in the price movement of a security. Bullish trends are characterized by increasing prices, while bearish trends are characterized by decreasing prices. It’s worth noting that these trends are not static, but rather they are always in flux.
A bullish trend can be identified by looking at a security’s price over time. If the price is consistently increasing, then the security is in a bullish trend. Conversely, a bearish trend can be identified by looking at a security’s price over time. If the price is consistently decreasing, then the security is in a bearish trend.
It’s also important to note that these trends are not always black and white. In other words, a security may not be in an outright bullish or bearish trend, but rather it may be in a sideways trend. A sideways trend is when the security’s price is oscillating between an upper and lower bound.
When using candlestick charts, it helps to be aware of both the bullish and bearish trends in the price action of a security. By being aware of these trends, you can make more informed investment decisions.
Candlestick patterns can be used to predict price movements.
Candlestick patterns can be used by traders to help predict future price movements. Hammer candlesticks, for example, are typically used to indicate that the selling pressure has subsided and that the bulls are taking back control of the market. Doji candlesticks, on the other hand, indicate that the market is indecisive and that a reversal could be imminent. Engulfing candles are another popular candlestick pattern, and they are used to indicate that a big move is about to take place.
movements
By utilizing these patterns, traders can make more informed decisions about when to buy or sell assets, which can lead to more successful trades. While no pattern is 100 percent accurate, familiarizing yourself with these patterns can help you to better anticipate future price actions, which can lead to more profitable trades.
Trading with candlestick charts.
Candlestick charts are important because they provide a graphical representation of a security’s price movement over a specific period of time. They can be used to identify trend reversals, trend continuations, and price points of support and resistance. Overall, candlestick charts are a valuable tool for technical analysis.
Laila Azzahra is a professional writer and blogger that loves to write about technology, business, entertainment, science, and health.